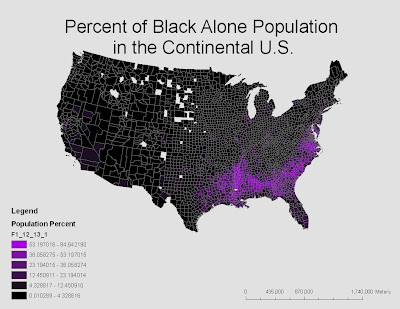
This map shows the percent of the population of African Americans or "Black Alone" race in the continental

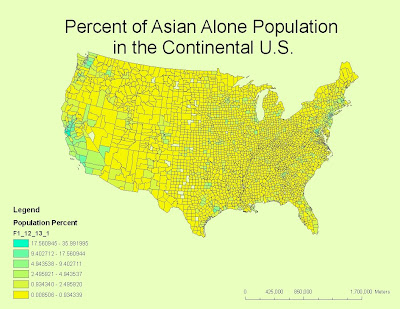
This map shows the percent of Asians in certain areas in the continental US or the “Asian Alone” population. The color scheme in this map and legend show that in green areas there is up to 35.991995% of Asians in certain populations and as little as 0.008506% in other populations. The areas in green show that there are the densest populations of Asians in areas surrounding
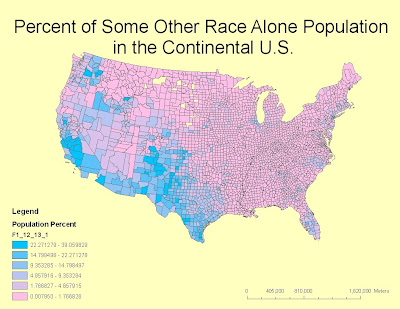
 This map shows the percent of an unknown race or “Some Other Race Alone” across the continental US. The blue to pink in the legend shows that there are as many as 39.059829% of “Some Other Race Alone” in certain areas in the continental US and as few as 0.007950% in other places. The areas with the largest population are in blue and the smallest are pink.
Compared to the African American population the populations with the most Asians are much less dense then the populations with the largest number of African Americans. There are smaller populations of Asians across the entire US but larger populations of African Americans and the unnamed race in major areas such as the South and the Southwest. Compared to the percentages of African Americans and Asians, there are very close to the same percentages of Asians and the unnamed race and both are much smaller then the percentages of African Americans. The unnamed race is similar the percentages of African Americans in that the populations are the largest in a confined area. According to the large number of the unnamed race in mainly Southwestern regions, it can be assumed that the unknown race is Hispanic or Latino. From the maps above it is impossible to tell how many of both populations there are but comparisons can be made between how dense a population is and how dense an area is.
From the labs we have completed this quarter and the lectures we have attended I feel like I have a fairly good grasp of what GIS is and its applications. While most of what we learned doesn’t hold much real life value for me, I can see how someone pursuing geography would find GIS applications very useful in the field. After using ArcGIS for many labs I can seen how the visualization of geography can help to really demonstrate data in creative ways that help to better represent the information provided. Although I don’t plan on continuing in GIS I enjoyed taking this class and feel like what I learned was of value and helped me to better understand and appreciate maps and geography.
No comments:
Post a Comment